
“We really can't forecast all that well, and yet we pretend that we can, but we really can't.” – Alan Greenspan, ex-chairman of the Federal Reserve
ECONOMY: THE ILLUSION OF CONTROL VERSUS THE WISDOM OF CROWDS.
Overconfidence, or the illusion of control, is one of the many pitfalls in behavioural finance that describes the tendency of people to overestimate their ability to understand and control events; the Federal Reserve is not immune to this type of behaviour and their aggressive, and largely unexpected, 50bps rate cut in September is a testament of that (we briefly touched on this in our previous market update).
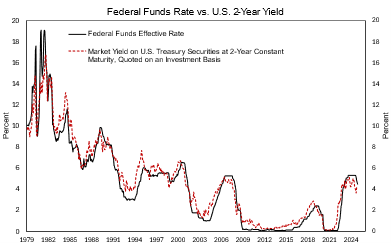
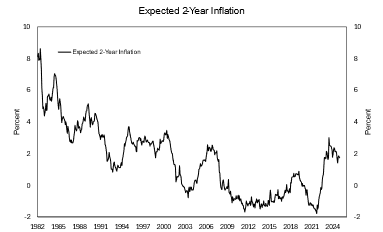
Two back-to-back weak job reports, during last summer, prompted the Fed to panic with regards to the state of the job market and to their ability to control the pulse of the economic cycle; their message was that inflation was on the right path towards target and that more attention needed to be diverted to the weakening job market. Even after three years of failures in bringing inflation back to 2.0%, the overconfidence in their ability to get inflation to target is not shaken. The reality, as of this writing, is that the job market, albeit not as strong as one year ago, is still very resilient and inflation is not declining as expected; on the contrary the common components of inflation are still hovering around 3.0%. We believe that the collective of investors is more accurate when it comes to the assessment of the economics’ pulse, the so-called wisdom of the crowd; we can see this in chart I where we show the yield on 2-year treasuries and the Fed Funds rate. Market participants always lead the Federal Reserve by many months in assessing what the next move will and should be, or what the appropriate level for interest rates is; some would argue that forward guidance is instrumental in shaping investors’ expectations, but the lead time in market rates is such that this statement does not hold when tested empirically. As can be seen in that same chart, investors were confident that the Fed had done enough hiking way before the last rate increase and are currently judging today’s level as appropriate for a continuation of the economic expansion. This should also bring inflation back to target as inflation expectations seem to be relatively anchored around 2.3%; historically real rates (2-year yield minus inflation) have averaged 2.0% since WWII. That is, investors’ current assessment is that the economy is back to a “normal” functioning, i.e. we are no longer in a Post-GFC economy.
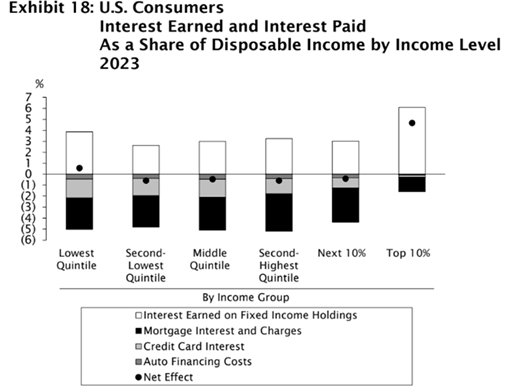
There are multiple factors explaining the resilience of the US economy, but we would like to focus only on three that we believe are the major ones. US households, supported by strong wage growth and with pandemic savings running out, are able to grow consumption in line with income growth. The highest quintile of the income distribution (representing circa 40% of consumer spending) in particular, is in its strongest financial position in a long time; the 55 and older cohort owns 70% of the residential real estate, with an average mortgage cost of around 3.9%. Simultaneously, the asset side of the balance sheet has a yield above 4.0% (chart II).
The lower and middle-tier households are struggling with stubborn inflation, but as long as the job market stays healthy, they will manage to stay afloat. Second, corporate CEOs have shown confidence in their outlook and their Capex plans have improved recently. At the same time, manufacturing PMI indexes are showing some tentative signs of improvement; it is hard to tell whether this is related to the massive AI investment boom alone or a combination of strong household formation, AI investments and other factors. The third factor is the “Elephant in the Room” or government deficit spending, which is not expected to be under control anytime soon. This excess spending is surely helping the economy sustain its growth trajectory in the short run but will certainly be detrimental to the long-term health of the US economy, financial stability and the US Dollar.
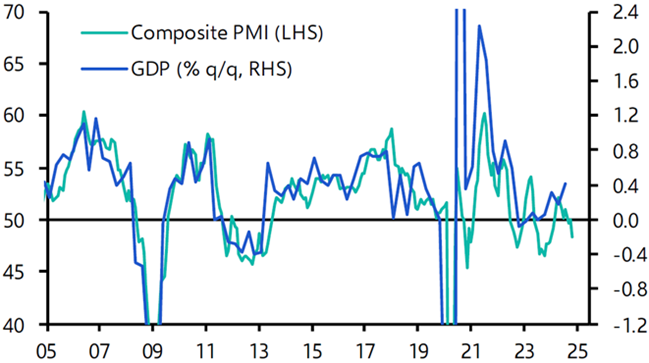
The two other major economic areas of the world, Europe and China, have very different economic situations. The former is flirting with a recession in its core countries, while the latter is engulfed in a balance sheet recession. In Europe, we have leading indicators that are still pointing towards a mild recession scenario for Germany and France (chart III), while the more service-oriented countries in the periphery are on a better footing. Our base case calls for a mild economic contraction in ’25, while economists are optimistically expecting 1.3% growth; we do not believe that more aggressive interest rate cuts by the ECB (as recently mentioned) will be enough to stimulate the economy. Let us not forget that China, the largest European trading partner, is a victim of the paradox of thrift; Chinese households, with the objective of putting their balance sheet in order, are collectively saving more than necessary with the result of hurting economic growth. We can see this malaise by looking at the trajectory of long-term interest rates, house prices and imports. Until the Chinese authorities will implement very aggressive housing policies, targeting homebuilders, households and financial institutions, the economy will continue to grow below potential.
FIXED INCOME: ARE BOND VIGILANTES WAKING UP?
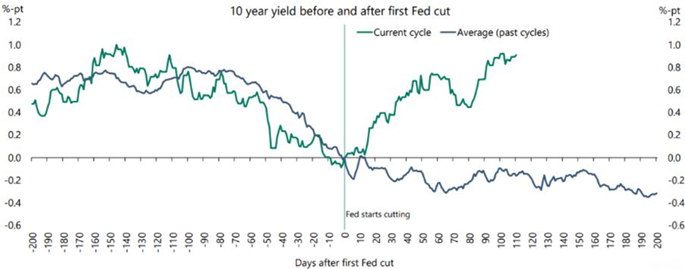
In our last update we described that historically when the yield curve un-inverts, i.e. long-term rates move back above short-term rates and the curve gets back to its normal shape (positively inclined), a recession is about to begin. This generally happens as short-term rates start declining faster than longer term rates and investors see weakening economic momentum as the precursor to a recession. Since the Fed began its accommodative monetary policy, 10-year yields have risen almost 100bps – an outcome that is opposite to any historical precedent (Chart IV). Bond investors are assessing the current environment as more resemblant to a mid-cycle lull than the peak of the cycle, the wisdom of the crowd at play again here. The Fed has adjusted its expected number of rate cuts this year from four (October ’24) to no more than two. Corporate bonds, both High Yield (HY) and Investment Grade (IG) are giving a similar message as corporate spreads and the volatility of spreads remains near the lows of the last 10 years. However, delving further, there are some areas of concern in our view, as the number of HY rating downgrades is surpassing the number of upgrades, indicating that some problems may be brewing under the surface. Smaller companies tend to be financed using variable rates and shorter maturities relative to IG and if rates stay elevated for longer than expected, smaller companies may not be able to adjust their business models and cost structures to cope with the new level of financing costs, which in turn will put pressure on profitability and potentially solvency.
We believe that the collective of investors is more accurate when it comes to the assessment of the economics’ pulse, the so-called wisdom of the crowd.
Thus, in this highly uncertain environment, and with valuations that are all but attractive, we continue to prefer sticking to the safest portion of the fixed income market. Investment grade companies offer strong balance sheets and an attractive absolute yield. Admittedly, they are not cheap compared to historical averages, but the risk of negative surprises is rather limited; the higher absolute level of yields will also allow for some moderate duration exposure in our view. An exception we would like to make concerns subordinated bank debt. While this investment is classified as one of the riskiest in the fixed income space, and it does carry heightened volatility during times of stress, banks currently offer strong capital bases, coupled with valuations that are still attractive, and long-term returns that can satisfy even the most discerning tastes.
In terms of duration, the recent jump in long-term government yields since early December, from 4.1% to 4.6% as of this writing, represents a good opportunity for those that missed out on the government bond rally, to jump on the bandwagon and increase portfolio duration while locking-in a rate above 4.0% annually for the longer-term.
EQUITY: REASONABLE ASSUMPTIONS?
In this note we take a different look at Dr. Hussmann’s statement in relation to the status of the US equity market: “I think we can all agree on two propositions. First, if enough speculators believe that stock market gains are driven by a tap-dancing squirrel monkey named Bobo, and Bobo starts tap-dancing, well, the stock market is going up, at least in the short run. Neither truth nor logic have anything to do with it. Second, because stocks are ultimately a claim on future cash flows, that must be delivered over time, higher starting valuations still mean lower long-term returns, which is why no speculative episode in history has ever ended well. Both of these propositions can be true at the same time.”
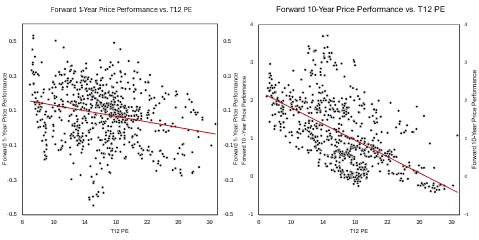
That statement can be represented in the scatter plot above (chart V); starting valuations have no correlation to one year performance (left plot) while, in the long-term the higher the price you pay for an asset, the lower the expected return is going to be (right plot). It is no secret that current equity valuations are stretched and significantly above the long-term averages, but what are the assumptions embedded in the current valuation paradigm? Are these assumptions reasonable? This is an important question to ask as over the last two years slightly more than 50% of stock market performance has come from multiple expansion. To assess the wisdom of the crowd’s assumptions, we did some reverse engineering to see if the implicit assumptions in the market’s valuation make sense.
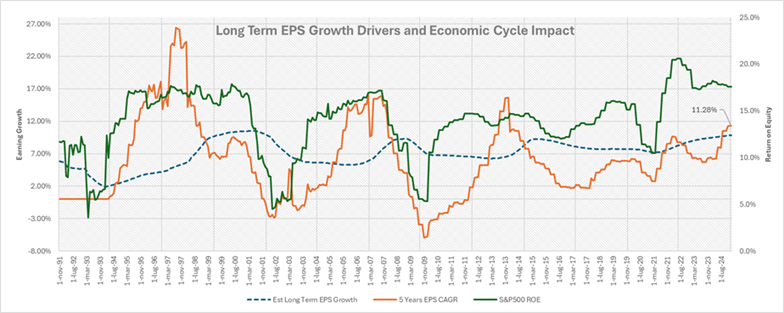
One of the most important drivers of valuation is the rate of earnings growth; over the last 10 years earnings have grown at an increasingly faster pace (orange line in chart VI) thanks to the increasing relevance of the Technology and Media sector. Faster earnings growth has been possible thanks to the long-term decline in interest rates, higher operating margins and reduced capital intensity of the technology/media business models. Since ’93 earnings have grown 4.5% faster than nominal GDP growth, so the current 11.5% growth implied seems reasonable to us, including buybacks. Dividend payout ratios have remained relatively stable around 40%, but what has meaningfully increased is the role taken by buybacks over the last two decades. With buybacks and dividends now making up 70% of ROE's capital return to shareholders, stocks are increasingly viewed as a more reliable investment, much like the saying 'a bird in the hand is worth two in the bush.' Investors now prioritize immediate returns over the uncertainty of future gains. This shift helps explain some of the recent multiple expansion. The final piece of the puzzle is the level of real interest rates embedded in the assumptions that currently stands at around 0.3%, higher than the post-GFC era but below the historical average (chart VII). Real rates around 1.0% would make the US equity market look overvalued by c. 10.0%. Further multiple expansion is unlikely in our view, so the most probable outcome for equity markets for the current year is to follow earnings growth.
In Europe, cyclical companies have outperformed more defensive ones as expectations for an economic recovery in the core of Europe will benefit them. As such, cyclical sectors have become more expensive than defensive ones. Given our outlook for the European economy, we believe a more prudent approach is warranted. Having said that, Europe is priced at a large discount versus the US, partly explained by the inferior growth and basically a non-existent technology sector.
The Chinese market remains extremely cheap, and the possibility of important government interventions may present an opportunity for quick gains. We still believe that the current setup is more akin to a Value Trap than a long-term investment opportunity, but if things change, we’ll revisit our stance.
CURRENCIES AND COMMODITIES
During the recent quarter, commodities had an impressive run, as the second derivative of Leading Economic Indicators have demonstrated that the worst may be behind us. Despite central banks having diminished their purchases amid very high prices, increased apprehension regarding the multiple war fronts, the stubborn behaviour of inflation in the US and mounting concerns about the fiscal imbalances of major governments continue to support the yellow metal. Partially, an argument that can be applied to the energy market as well, where crude prices have increased 11.0% since early December. However, the new administration’s drilling campaign may prove the latest spike as temporary.
The quarter saw a meaningful appreciation of the USD, as short-term yield gaps were increasingly in favour of the greenback. Long-term, we continue to believe fundamentals will kick-in, and the USD is set to depreciate.
The depreciation of the Euro has likely run its course against the USD for now as expectations for relative movements in interest rates have been digested. In Switzerland, the Swiss National Bank announced that further cuts may be necessary, and negative rates may not be out of the question, all in order to mitigate the strength of the Swiss Franc. However, the solid finances of the Swiss government, a relative strong economy, and the safe-haven role of the Swiss Franc will make it hard for the currency to depreciate heavily.[1]
[1] Document sources: Capital Economics, BCA, 3Fourteen Research, Creditsight, Empirical, Vontobel, Factset, Refinitiv IBES, Hussman Strategic Advisors, Yardeni, FED od St. Louis, Bloomberg.
About the author
LFG+ZEST SA