
ECONOMY: INFLATION REMAINS IN THE SPOTLIGHT
Interest rates are one of the key variables for estimating the Intrinsic Value of the stock market and consequently its expected long-term return. Intrinsic Value and Expected Return models have a fairly high predictive power, while forecasting short-term market movement is a nearly impossible task. With this in mind, every investor has a choice between allocating towards the bond market with near risk-free returns or the equity market; the approach towards the two asset classes should depend on how much extra return compensation we would get by allocating more towards the riskier asset class.
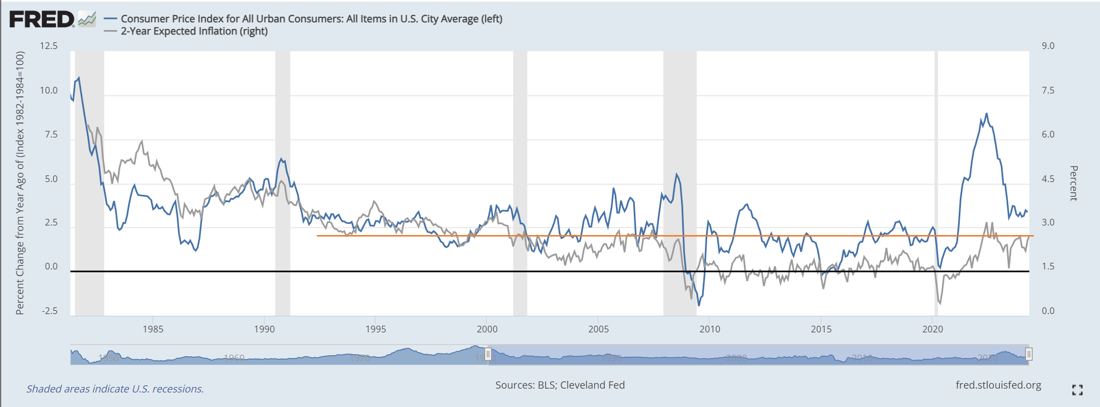
Inflation and future inflation expectations are crucial factors in determining the path of interest rates over time. Chart 1 shows the trend of two-year inflation expectations (grey line) and the Consumer Price Index (CPI) (blue line) from 1980 to today. In previous years, particularly after the Great Financial Crisis, inflation expectations were very low and deflation fears were surfacing at times. Central banks, despite their monetary policy efforts (near-zero rates and Quantitative Easing), were unable to bring inflation back to the 2% annual target. It's important to note how rates and inflation expectations have moved back to a more "normal" state following the massive fiscal impulse that was put in place to help households and businesses during the pandemic period; the government fiscal stimulus almost coincided with the end of US household deleveraging that begun in ’09, so there was no balance sheet counter force to stop inflation from taking off. The central banks' response came in March 2022 when the FED raised interest rates to contain inflationary pressures. We have thus exited the old regime of "zero rates," entering the “new-old regime” characterized by higher rates, higher inflation and inflation expectations, factors that will eventually impact stock market valuations.
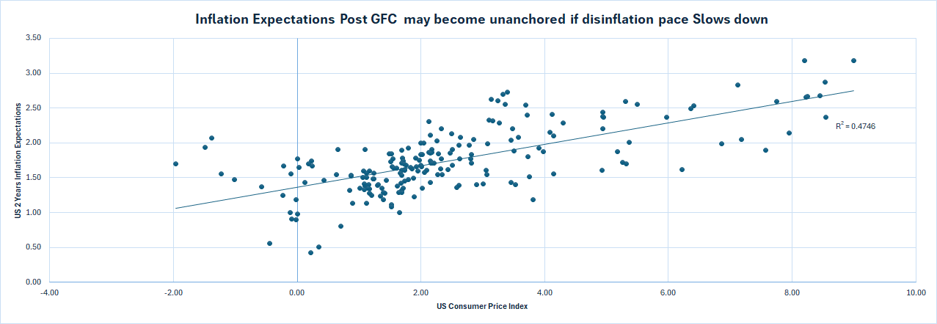
It should be emphasized that there is a strong relationship between inflation expectations and actual inflation. Chart 2 illustrates the positive correlation between inflation expectations and CPI. We can state that inflation is self-reinforcing: the more it grows, the more future expectations rise, and vice versa. Therefore, it is crucial to continue monitoring the downward trend of inflation so that expectations adjust and return to around being anchored at around 2%.
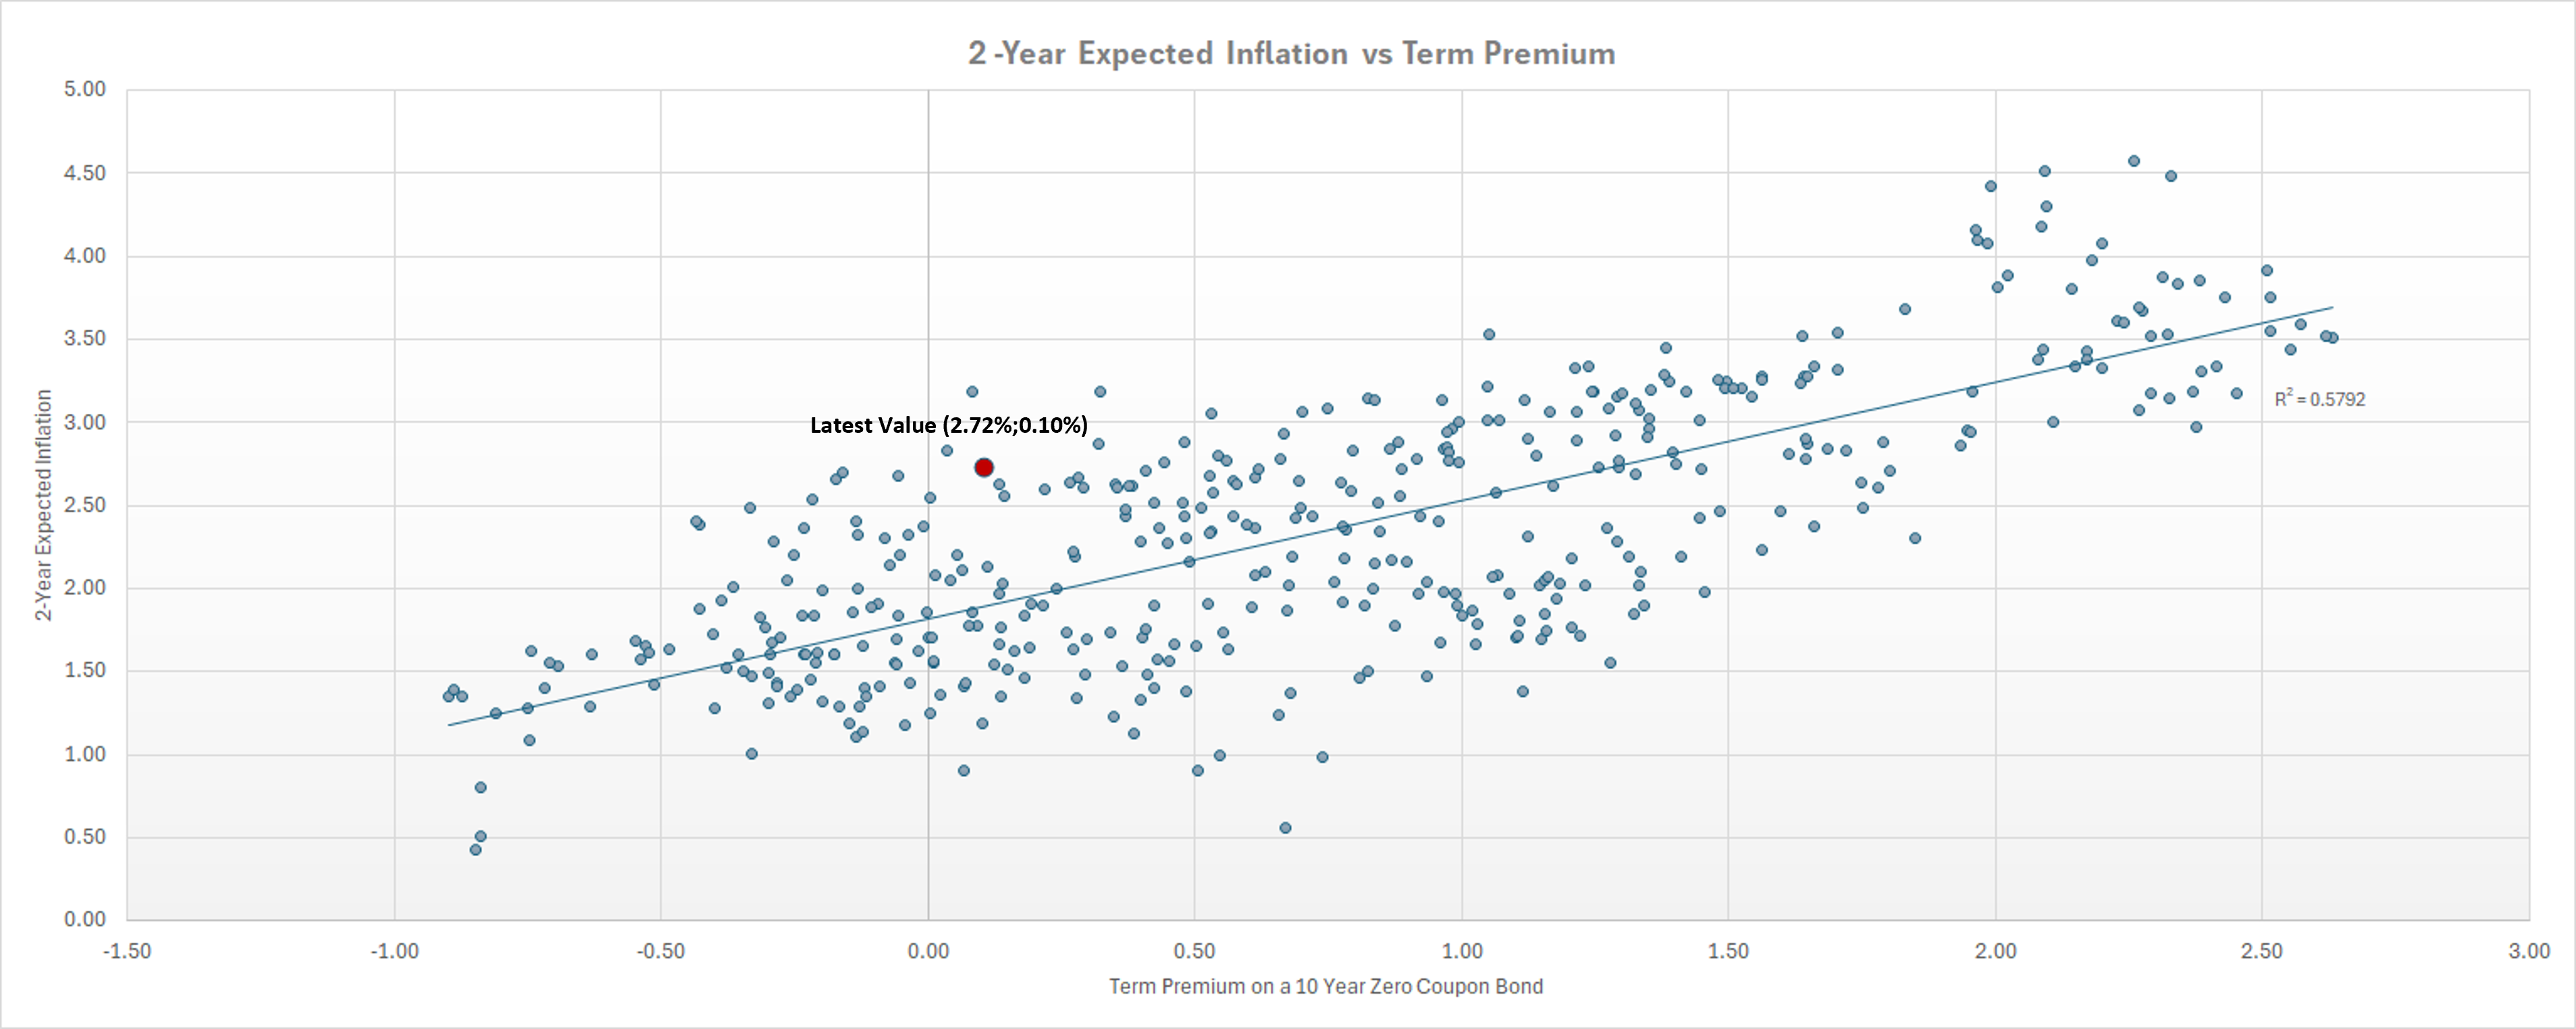
Another variable that will determine the future level of interest rates and hence the valuation of equities is the Term Premium (excess return to compensate for duration risk). After the Great Financial Crisis, it remained close to 0% due to the ultra-expansive monetary policies and very low inflation expectations. Chart 3 shows the positive correlation between the Term Premium and inflation expectations. The normalization of expectations should lead to a slightly higher Term Premium compared to the current near zero level. This means that we will likely see the 10-year U.S. Treasury yield (one of our inputs for equity Intrinsic Value models) between 4% and 4.5%, composed as follows: expected inflation 2%, Term Premium 0.5%, and real growth of 1.5% to 2.0%.
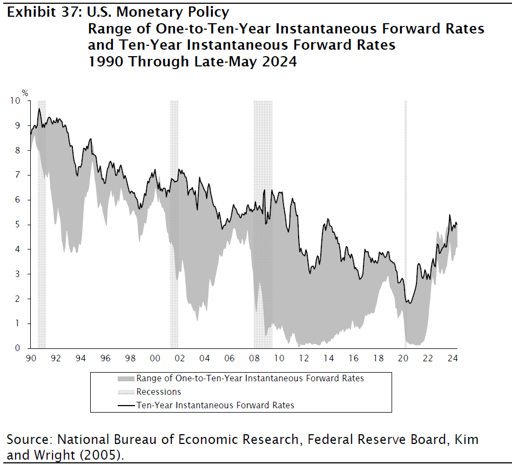
Further confirmation of this analysis comes from the FED's estimate, which projects the 10-year U.S. Treasury bond yield to be in the range of 4.0% to 5.0% (Chart 4). Therefore, we can assert that the long-term bond market is currently priced correctly.
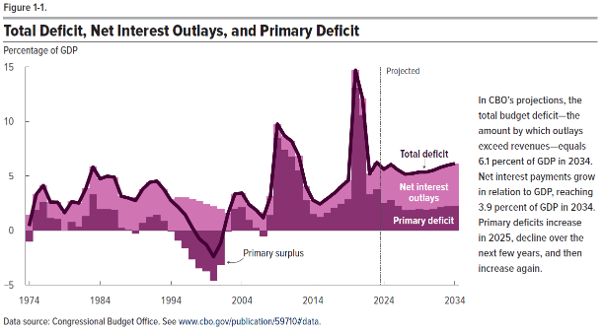
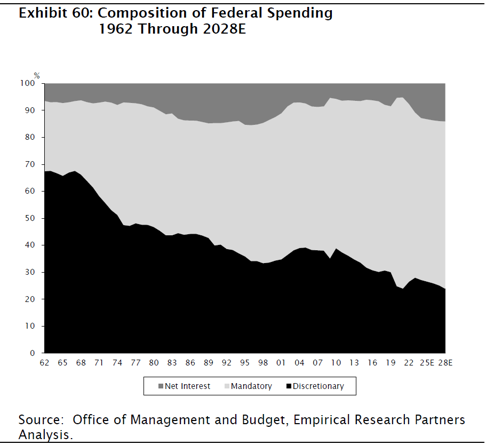
A variable that could push the effective rate towards the upper end of the 4%-5% range, if not beyond, is the U.S. government budget deficit. Chart 5 shows the projections from the Congressional Budget Office until 2035, with the deficit remaining heavily negative at circa 6.0% annually, increasing the debt burden to roughly 170% of GDP by end of the next decade, in no countermeasures are not enacted. In the following chart, in addition to rising interest costs as a percentage of government outlays, there is a clear and continuous increase in mandatory spending (expenses that cannot be reduced). If uncontrolled, this phenomenon risks becoming unmanageable over time, creating potential fiscal tensions and market dislocations due to the enormous debt, with consequent repercussions on interest rates.
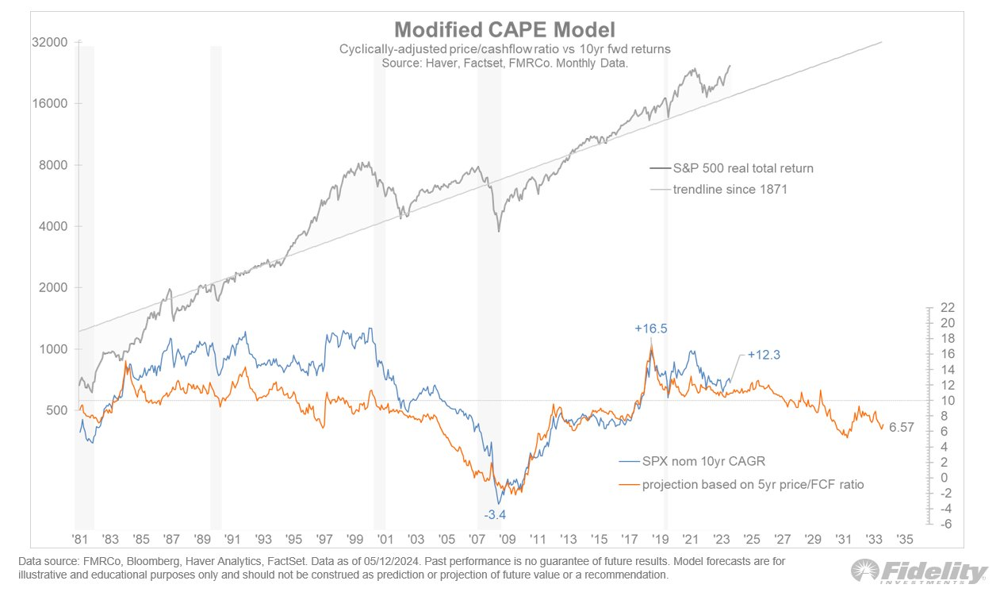
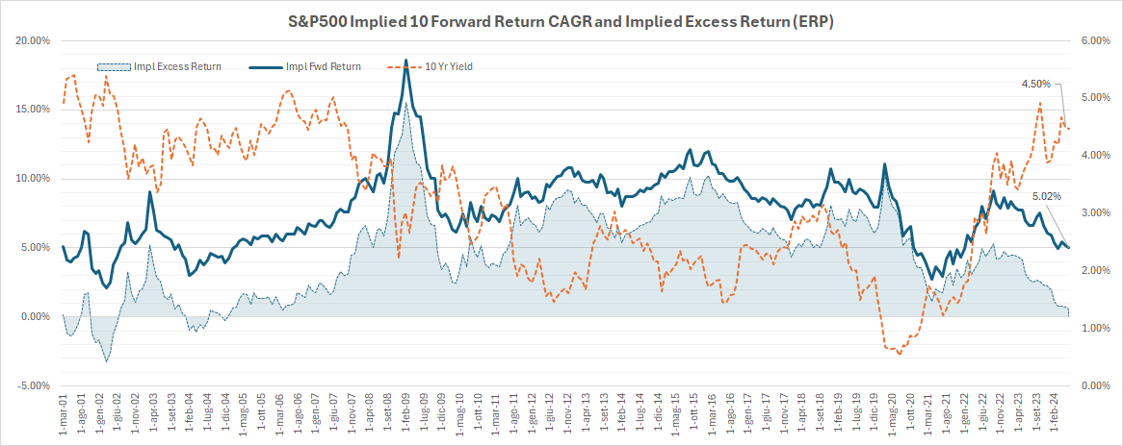
After determining the yield of a 10-year U.S. Treasury bond, considered as a risk-free investment, let's now look at the expected 10-year return for the stock market, specifically the S&P 500 index. Chart 7 shows an analysis conducted by Fidelity using their internal quantitative model. The orange line represents the expected annual return for the next ten years, currently at 6.57%, while the blue line represents the actual 10-year return. The correlation between the two lines is significant, especially post-Great Financial Crisis, demonstrating the model's good predictive ability.
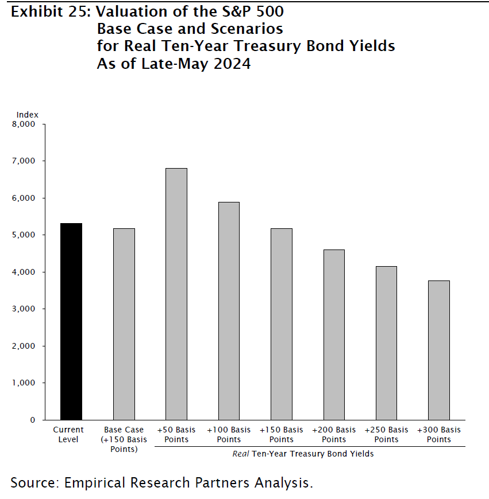
Another analysis was conducted by Empirical Research. Chart 8 shows the fair value of the S&P 500 given certain levels of real interest rates. With real rates between 1.50% and 2.50%, the fair value is in a range between $5’200 and $4’300.
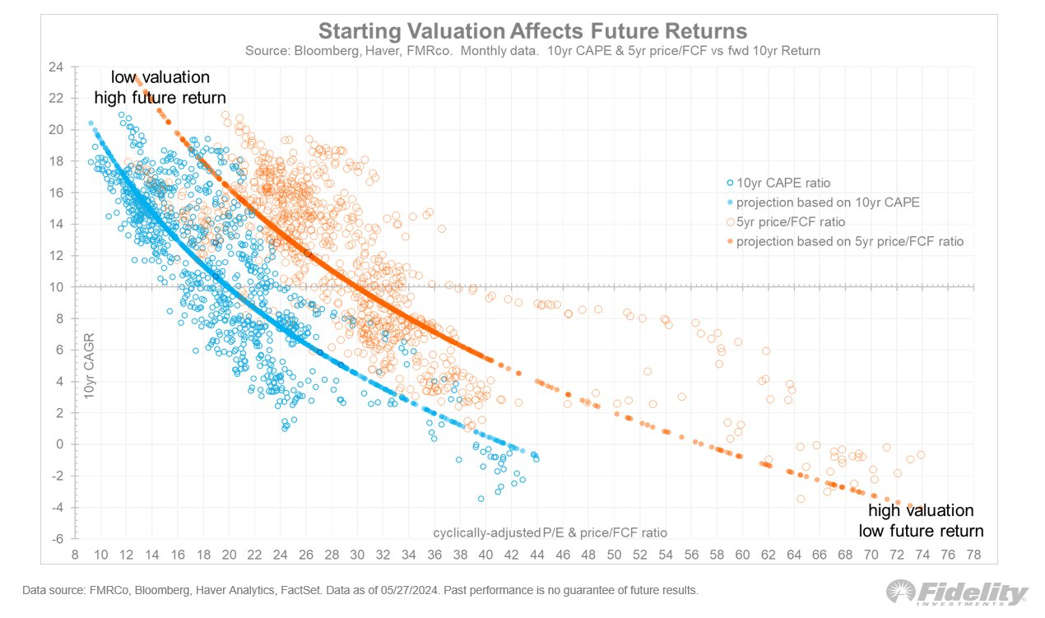
The starting valuation multiple is a key determinant of long-run expected returns, as in the short run multiples are influenced by investors’ psychology, while in the long run fundamentals matter more. Chart 9 illustrates the relationship between the valuation multiple and the long-run expected return. The orange line represents the P/FCF multiple and its projection, while the blue line represents the P/E multiple and its projection. Paying a high multiple, compared to the historical market average, makes it more likely that our long-term return will be low.
These charts confirm the accuracy of our analysis conducted in last month's study. Chart 10, shared in the previous newsletter, is very similar to the results obtained from Fidelity's quantitative model.
Currently, the expected return on the stock market is not so attractive, in fact, the Equity Risk Premium (excess return that investors receive for holding riskier securities) is about 0.50%.
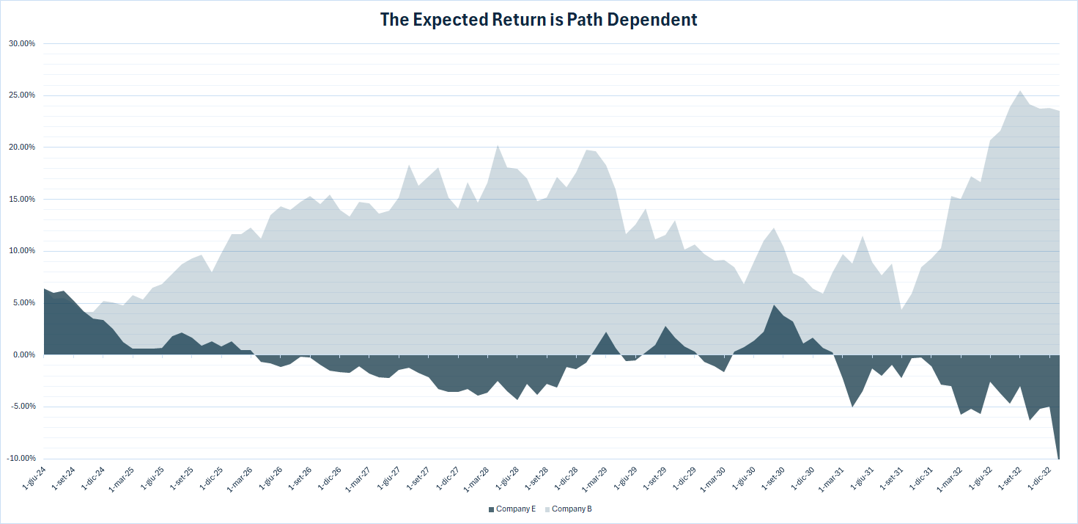
Before concluding, we want to show you another study that aims to show how impactful short-term performance can be in terms of results.
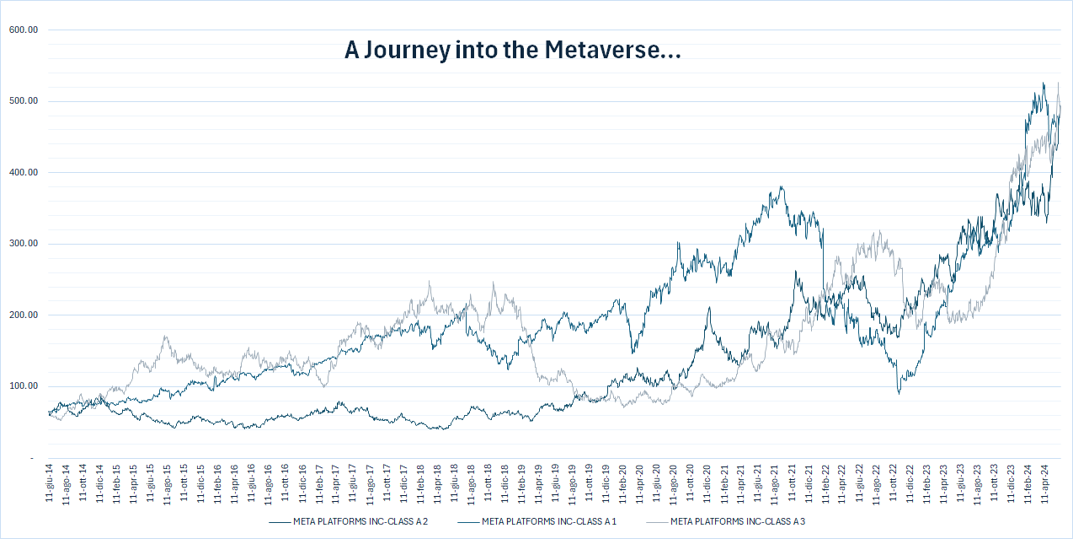
In Chart 11 we have represented the historical price of META over the past ten years and then generated two more series with the same characteristics, in terms of starting price, volatility, and ending valuation. The three time series have the same annual return and volatility by the time they get to year 10 but they accrue differently; the path to achieve that same annual return varies.
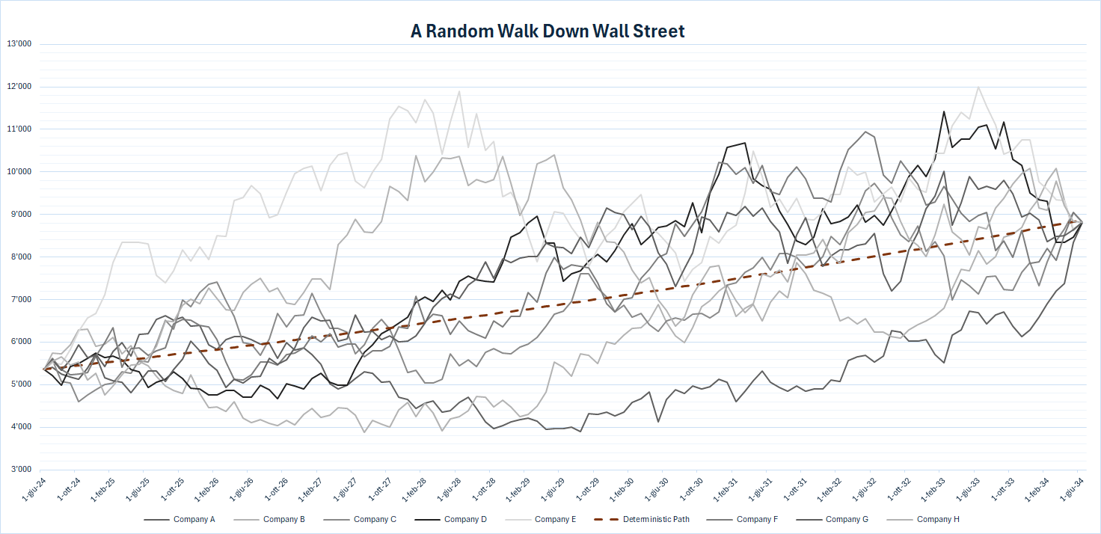
This thought exercise or analysis was also carried out from a market-level perspective. Assuming as inputs the results of our internal model (Chart 10): future S&P500 return of 5% and index volatility of 15% (historical S&P volatility), eight possible scenarios are shown in Chart 12. The dotted orange line represents the constant 5.0% annual return. Again, it is shown that reacting to short-term fluctuations would be a mistake, in fact, in the long run the outcome is the same for any market hypothesis, it’s the path to achieve that same return that changes.
What really matters and makes a difference in long-term performance is the price that is paid at the time of investment. Chart 13 shows the expected return, at each point on the timeline, associated with the best path and worst path in Chart 12. If we know the intrinsic value of the market, at any given time an investor has to decide whether to invest in stocks, if the implied excess equity return is large enough or it is more prudent to sit on the sidelines and accrue risk free returns, because as we have shown the starting valuation price determines future returns.
About the author
LFG+ZEST SA