In recent weeks, geopolitical developments have dominated the spotlight. However, it is important not to lose sight of how key macroeconomic variables are evolving. For this reason, we have decided to analyze the potential impact of tariffs, as well as the outlook for inflation and consumer spending in the United States over the coming months.
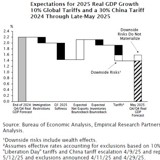
Tariffs will undoubtedly impact U.S. economic growth, though they are unlikely to trigger a recession. As shown in Chart 1, under the assumption of a global tariff of 10% and a 30% tariff specifically targeting China, growth expectations for 2025 are projected to decline from +2.2% at the end of 2024 to +1.4% by the end of 2025. It is important to note that these figures are highly volatile and difficult to forecast, particularly given President Trump's frequent reversals on previously announced decisions. As a result, this slowdown is expected to weigh on corporate earnings within the S&P 500, which have already been revised downward in recent weeks. Nevertheless, there are currently no clear signs of an impending recession. Rather, the U.S. economy may be entering a mid-cycle slowdown largely driven by the tariff issue.
On the household side, the BBB is expected to have a significantly positive effect, nearly comparable to the levels seen in 2018–2019. However, the overall burden of tariffs (Chart 3) is likely to outweigh these benefits. In fact, 60% of lower-income households will be disproportionately affected by the new duties, losing more than 1% of their current purchasing power. By contrast, the impact on higher-income households will be virtually negligible.
As a counterbalance to the negative impact of tariffs, the Trump administration has recently announced plans to implement the “Big Beautiful Bill” (BBB), a package of tax breaks and reductions. However, this new legislation is expected to have a more limited effect on corporate earnings compared to the tax cuts introduced during Trump’s first term, and it will primarily benefit specific sectors. In particular, when it comes to capital expenditures (CapEx) and research & development (R&D), the sectors likely to experience the greatest tax savings on free cash flow are pharmaceuticals, automotive, and utilities. Taking into account the combined impact of both tariffs and the “BBB”, the pharmaceutical sector emerges as the main beneficiary, with revenue growth expected to reach +2% year-over-year (Chart 2).
Turning to inflation, understanding recent dynamics requires starting with immigration, as the two are closely linked. Chart 4 illustrates the share of foreign-born individuals in both the U.S. labor force and rental housing units between 2020 and 2024/25. In both areas, their growth has outpaced the overall population by a significant margin. This trend, particularly in terms of demand for rental housing, has driven rental prices sharply higher. These elevated price levels have persisted over time, exerting substantial upward pressure on the overall inflation rate.
Since Trump’s election, the flow of illegal immigrants entering the country through the southern border has declined sharply, as clearly shown in Chart 5.
This trend is expected to have a mechanical effect in driving rest prices lower and, consequently, in reducing inflation. As rental contracts expire and are renewed at lower invremental rates (inflation is the change in prices year on year, not the price level), the rent component, which accounts for roughly 35% of the inflation basket, will exert a significant disinflationary impact on overall inflation. As shown in Chart 6, the Consumer Price Index (CPI), excluding the rent component, has already been hovering around 2% for over a year. This analysis could prompt the Federal Reserve to cut interest rates as early as the upcoming July meeting, despite market expectations pointing to the first cut in September.
MARKET VALUATIONS
Finally, on the consumption side, households currently appear to be in very good financial shape, as evidenced by Chart 7, which shows the ratio of home equity to consumer spending. This indicator can be used to gauge the potential for households to take on home equity loans as a way to boost consumption. Naturally, on the other side of the equation, this would require both a reduction in interest rates by the Federal Reserve and a loosening of credit standards by banks, two factors that have significantly constrained lending activity in recent years.
MAHA & Health Care
The relative performance of the Health Care sector compared to the S&P 500 from October 2023 to today has been significantly negative, the worst among all the cycles shown in Chart 8.
This dynamic is also clearly visible in the lower section of Chart 9, which illustrates the relationship between the three-year compounded annual growth rate (CAGR) of the sector versus the S&P 500 index. The sector is currently at oversold levels, nearly two standard deviations below its historical average, an indicator that highlights the extremely negative momentum over the past three years. This situation could act as a catalyst for potential sector outperformance in the coming months/years.
Beyond the negative performance, two additional factors support the possibility of a rebound: estimated growth over the next two years and valuations. Chart 10, highlighted by the red dot representing the median level across the entire industry, shows that Health Care ranks as the second-fastest growing sector for future growth, trailing only Technology.
Chart 11, on the other hand, highlights the attractiveness of the industry from a valuation perspective. The Health Care sector’s free cash flow yield stands at 4.78%, approximately 170 basis points higher than the two-year Treasury yield, once again underscoring the excellent opportunity the market offers. Additionally, given the market high valuations and the sector defensive nature, investing in Health Care can also be seen as a way to reduce portfolio volatility.
Fair Value S&P 500
Finally, as we often do, we present the Fair Value of the S&P 500 index according to our internal quantitative model. Currently, the year-end estimate, assuming no recession, stands at around 6,100 points. As of today, the index is very close to this level, and over the coming months, depending on where earnings growth settles, we could see fluctuations between 5,700 and 6,300 points, as highlighted by the red circle in Table 1.
Another reason we might see volatility in the coming months, with the S&P 500 trading within this range, is the July 9 deadline for Europe to reach a tariff agreement with the United States. If negotiations conclude successfully, the market will likely remain resilient, disregarding potential negative geopolitical news. This resilience would be supported by the six-month percentage change in consensus earnings estimates over the past twelve months, which remains very high (Chart 12).


About the author
LFG+ZEST SA