
VOLATILITY & RECESSION RISK
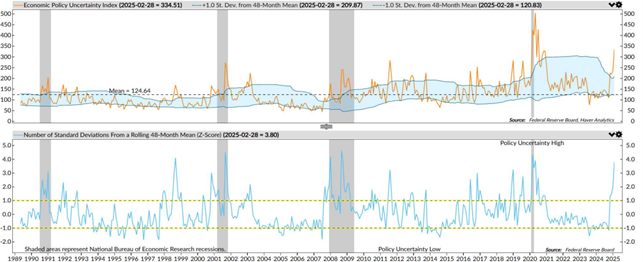
The volatility observed in the stock markets in recent weeks is largely driven by the assertive and unpredictable communication style of US President Donald Trump. His contradictory statements have fueled uncertainty among investors, raising concerns about a potential recession and making it difficult to envision a clear and positive economic trajectory. This period can be seen as a transition, a total break from the status quo to which we had grown accustomed. This dynamic is clearly reflected in Chart 1, which illustrates the market’s level of uncertainty.
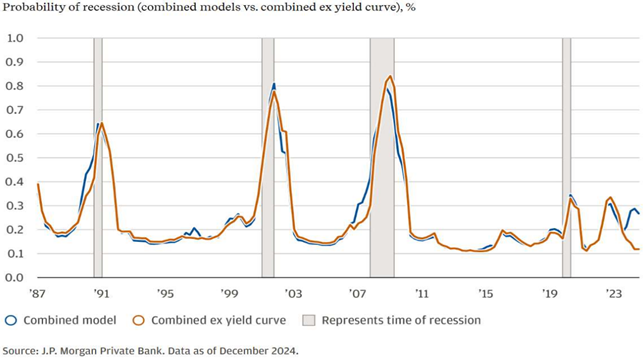
At present, however, the recent downturn in the US stock market appears more like a healthy correction than the onset of a bear market driven by recession fears. One key factor supporting this view is the profound transformation the US economy has undergone since the Covid-19 pandemic, making it far less sensitive to rising interest rates than in the past. Massive fiscal stimulus and widespread mortgage refinancing at historically low rates have strengthened the resilience of both consumers and businesses, allowing them to better withstand sharp and sudden rate increases. This concept is illustrated in Chart 2, which presents a J.P. Morgan analysis of the likelihood of a US recession. The blue line represents a model that incorporates both macroeconomic factors and the shape of the government yield curve, meaning that any interest rate fluctuations influence the final outcome. In contrast, the orange line is based solely on macroeconomic variables, excluding interest rate effects. From the late 1980s until the most recent rate hikes, the two lines have followed a remarkably similar trajectory. However, a notable divergence has emerged in recent years, highlighting the US economy’s reduced sensitivity to interest rates and, consequently, a lower probability of recession than traditional models might suggest.
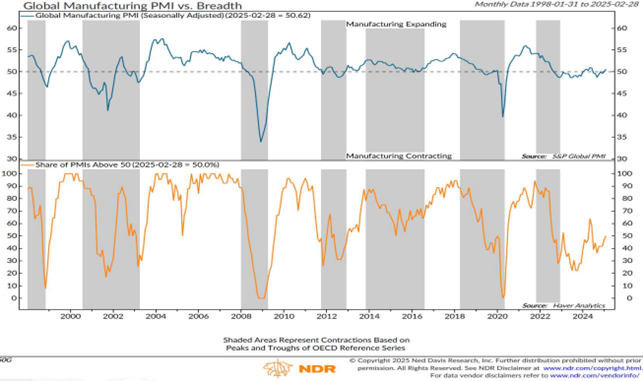
Another indicator supporting the low probability of a recession is the ongoing recovery in the manufacturing PMI. As shown in Chart 3, the blue line in the top graph indicates that the global index has surpassed the critical 50-point threshold, which separates expectations of economic expansion from contraction. Further reinforcing this trend, the orange line in the lower graph highlights the growing number of countries where the manufacturing PMI now exceeds 50.
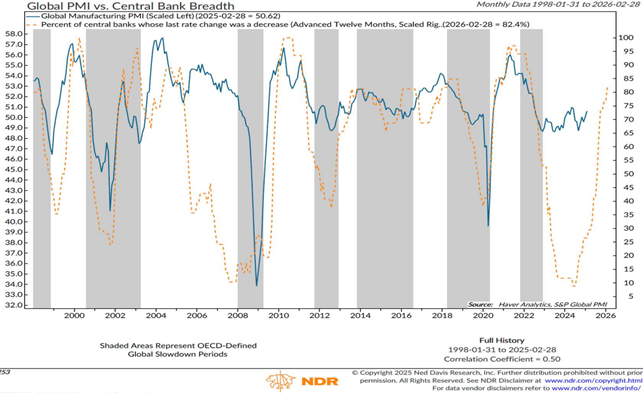
Supporting the recovery of the manufacturing sector is the accommodative stance of global central banks, most of which are in ‘Easing Mode.’ As shown in Chart 4, over 80% of Global Central Banks have lowered their key interest rates in their most recent meetings. This represents a further positive signal for the revival of the manufacturing cycle.
Meanwhile, the services sector continues to show resilience, as illustrated by the orange dotted line in Chart 5, which represents the ISM Services Employment Index. Labor demand remains strong, and on the manufacturing side (blue line), there are signs of stabilization and potential improvement.
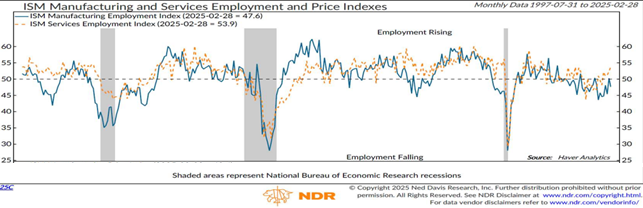
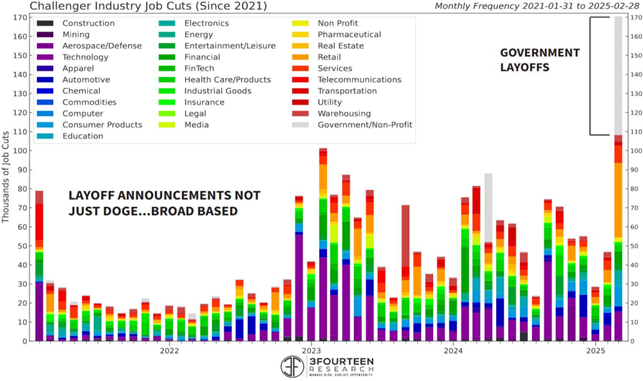
Chart 6 further confirms the resilience of the US labor market, though the latest Job Cuts data reflects a distortion due to the significant number of government layoffs implemented by the Trump administration. The other weak spot in the economy is the real estate sector; however, it is important to note that most of these job losses are concentrated in construction-related fields. Specifically, layoffs have primarily affected real estate agencies and financial institutions issuing mortgages, as higher interest rates have dampened demand over the past two years. Nonetheless, the sector remains relatively healthy, supported by strong underlying structural demand.
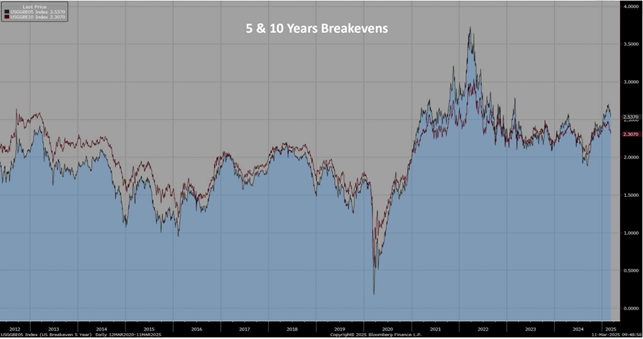
Lastly, an additional factor that could help ease the high uncertainty observed in financial markets in recent weeks is the 5- and 10-year US Breakeven Index, which reflects market expectations for average annual inflation in the coming years. As shown in Chart 7, these indicators, after peaking earlier in the year, have begun to decline again, reducing the risk of a renewed inflationary surge. This trend can be attributed to three key factors. First, wage growth is returning to a non-inflationary range, hovering around 4.0% year-on-year. Second, the housing market, particularly the rental segment, is stabilizing. Third, oil prices, a crucial driver of inflation, are currently declining. Historically, inflation has never accelerated without a corresponding rise in oil prices, and this downward trend is reflected in US breakeven rates. As a result, we can infer that tariffs are unlikely to have a “significant” impact on price growth. Combined with the economy’s lower sensitivity to interest rates, the improvements in manufacturing, the strength of the services sector, and the resilience of the labor market, this leads us to believe that the probability of a US recession is actually lower than estimated by many traditional models.
WHAT THE MODELS SAY
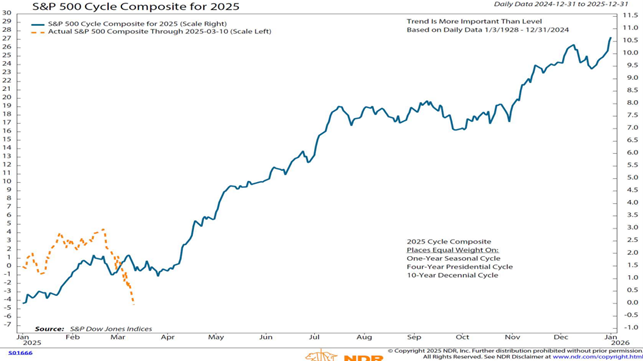
Considering the above analysis, it is interesting to look at Chart 8, which is annually prepared by the independent company Ned Davis. The blue line, using data from 1928 to the end of 2024, represents the average performance of the S&P500 index composed, in equal weight, of the annual performance, that of the first year of each presidential cycle, and that of the fifth year of each decade. This index statistically describes the historical behaviour of the S&P500 by combining the above data. Assuming that this trend could be repeated in 2025, we could consider the slight correction observed since the beginning of March to be ‘normal’, in fact, the graph shows that historically the index's trend between March and April has been sideways/slightly downwards. The subsequent growth is also evident, the average S&P, adopting these assumptions, finished the year at around +10%.
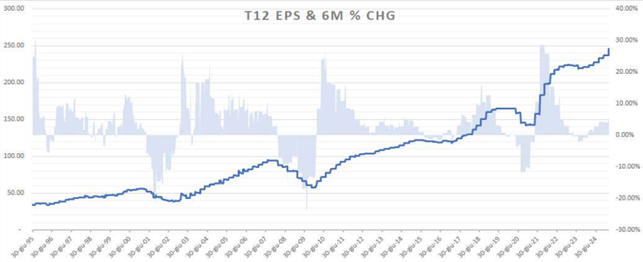
This assumption could be supported by the recent revision of EPS estimates (Chart 9) of the S&P500 companies, which has been very strong over the past six months.
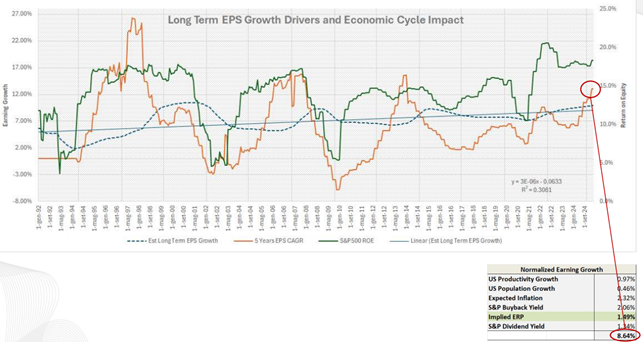
This is also evident in Chart 10, the orange line describes the annualised EPS growth over the past five years, which shows a significant acceleration. Furthermore, the ROE (Return on Equity) of the index (green line) is at much higher levels than in the past. These levels, given the composition of the index, permit a reasonable estimate of earnings growth around 10-12%, which could justify a market upturn in the coming months, although the EPS growth discounted by the current value of the S&P is around 9%.
About the author
LFG+ZEST SA